See exactly how HT Bot manages your trades
Real-time P&L, automated bot execution, trade history, and market data — all in one dashboard. Built for traders who need control without the screen time.
Dashboard Overview
Desktop Mobile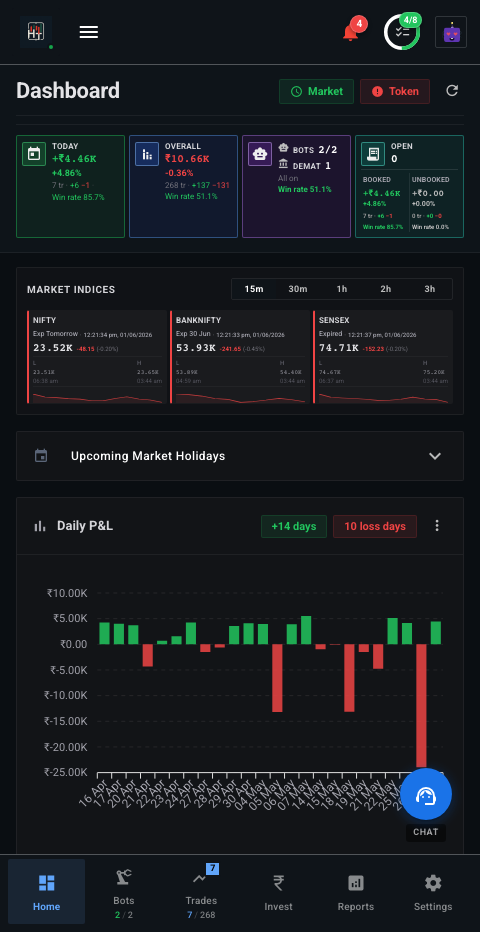
Account Metrics & Status
Real-timeProfit & Loss Tracking
- Unbooked P&L — Live unrealized P&L from open positions
- Booked P&L — Realized gains/losses from closed trades
- Net P&L — Combined total with percentage return
- Today / Overall toggle — Switch between daily and all-time views
Status & Security
- Demat Accounts — Connected broker account status
- Active Bots — Running vs. total configured bots
- Market Status — Open, closed, or pre-market
- Access Token — Broker API token validity
Market Data & Analytics
LiveMarket Snapshot
Nifty 50, Bank Nifty, and Sensex LTP with net change and percentage. Green/red indicators for instant direction read.
Bot P&L Chart
Cumulative profit/loss over time. Toggle Today / Overall. Hover for exact values and timestamps.
Open Trades Chart
Track unrealized P&L for current positions. Identify when to hold or exit based on trend visualization.
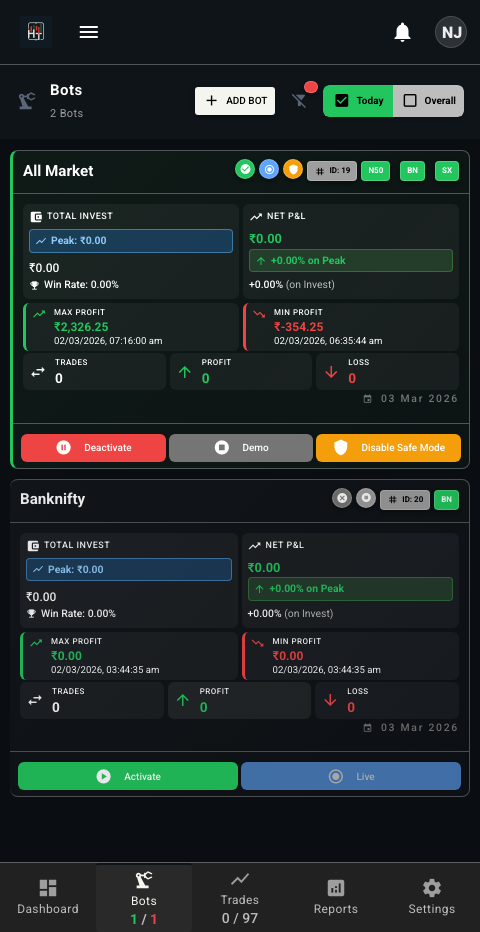
Bot Management
AutomationBot List
- Status — Active, paused, or stopped at a glance
- Live P&L — Current performance per bot
- Quick Actions — Start, stop, configure instantly
- Search & Filter — Find bots by strategy or status
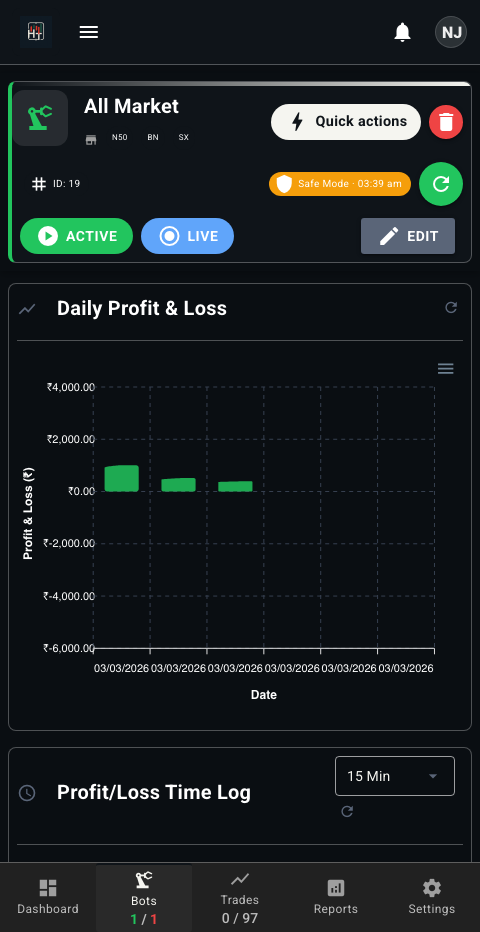
Bot Configuration
- Strategy Settings — Define entry, exit, and risk rules
- Performance Metrics — Win rate, avg return, max drawdown
- Trade History — Every execution logged with detail
- Risk Controls — Stop-loss, position sizing, max exposure
Trade History & Analysis
Audit TrailTrade List
- Date Range Filter — Analyze any period
- Bot & Strategy Filter — Isolate specific systems
- P&L Sorting — Best and worst performers first
- CSV Export — Download for external analysis
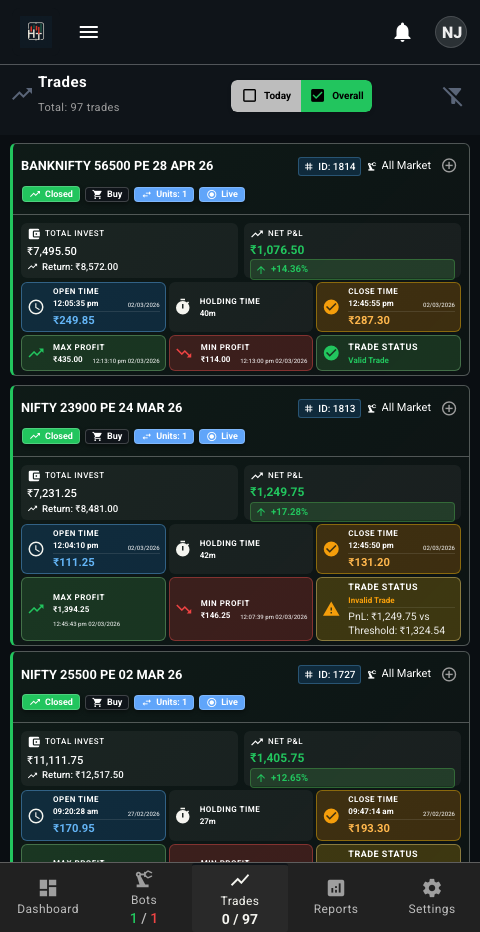
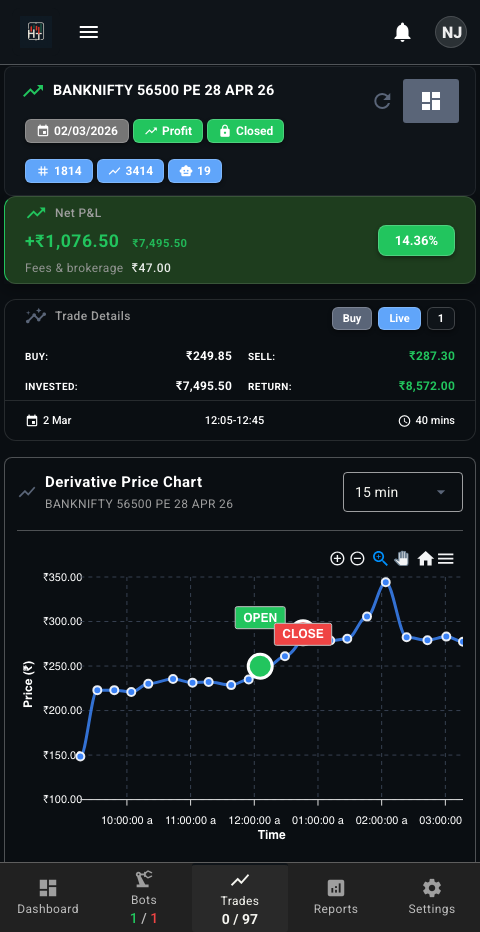
Trade Detail
- Entry / Exit — Exact prices and timestamps
- P&L Breakdown — Gross, fees, and net
- Holding Period — Time in trade
- Strategy Context — Which bot and why
Platform Capabilities
CoreReal-Time Analytics
Live P&L charts, performance metrics, and trade history updated continuously during market hours. No refresh needed.
- Cumulative P&L tracking
- Open position monitoring
- Win rate calculation
- Drawdown analysis
Bot Management
Create and manage multiple bots with distinct strategies and risk profiles.
Strategy Config
Customize entry rules, exit conditions, stop-loss, and position sizing. No coding required.
Notifications
Instant trade entry and exit alerts, daily P&L summaries, and platform announcements via Telegram.
Risk Controls
Built-in stop-loss, daily loss limits, and max exposure caps to protect capital automatically.
Multi-Platform Access
Full feature parity across web dashboard, Telegram bot, and Android app. Manage trades from anywhere.
- Web dashboard
- Telegram bot
- Android native app
- Real-time sync
Ready to take control?
Start with paper trading. Zero risk. Test strategies and understand the platform before going live.
Get Started Free